Some of us love our jobs – eager to jump out of bed in the morning and get stuck in with what the day has to offer. Whilst others dread their commutes into the office, feeling overworked and under rewarded for our efforts. But just how many UK adults are satisfied with their jobs in 2023? How comfortable do we feel asking for pay increases? And how much confidence do British workers have in their company’s leadership?
Here, we share all of this and more, revealing the latest job satisfaction statistics of 2023.
Employee satisfaction statistics: Key facts for 2023
Short on time? Here are our key findings:
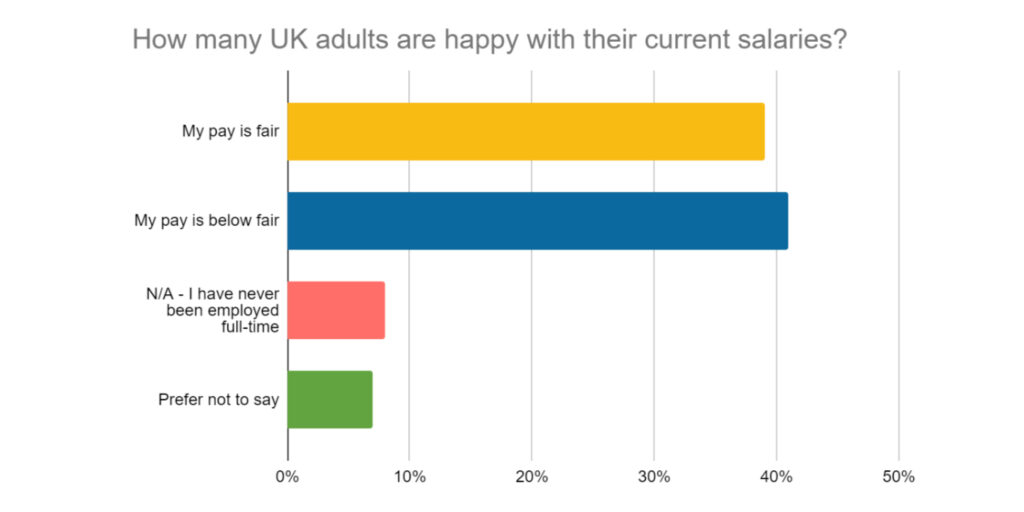
- 41% of people in the UK feel that they’re paid less than they should be for the job they’re doing.
- 61% of UK adults are not planning on asking for a pay rise in the next 12 months, even though only 39% feel they’re currently paid fairly.
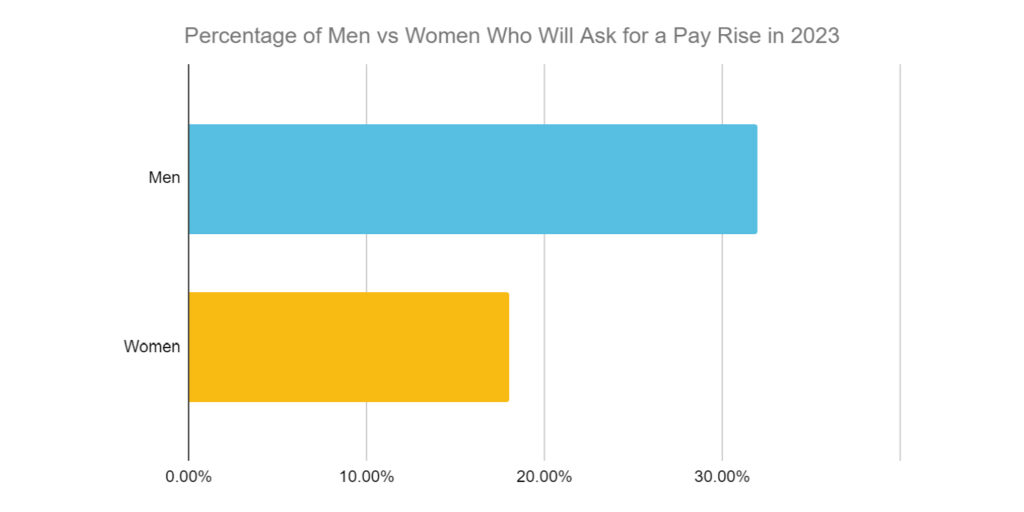
- Almost twice as many men than women plan on asking for a pay rise in the next 12 months (32% vs 18%). Men are also more likely to ask for larger pay increases than women.
- More than 1 in 10 UK adults have no confidence in the leadership of their company, feeling that they cause more harm than good.
- 1 in 20 Brits feel they’re not very good at their jobs.
- People who have children tend to feel less confident in their ability to do their jobs.
- Online searches for ‘jobs near me’ spiked in mid-January 2023.
- The most in-demand job role in the UK in 2023 is project management, with over 5,000 online searches being conducted every month in the UK for project management jobs.
How many people in the UK are satisfied with their salaries?
One of the most common complaints people tend to have about their jobs is related to salary and not being paid what they deserve. That’s why in February 2023 we surveyed 2,104 UK adults using the marketing research company YouGov.
We asked how financially compensated respondents feel (or have felt, if no longer employed) with their salary. Responses revealed that:
- Only 39% of people in the UK feel their salary is fair, and in line with their skills and abilities.
- Whilst a staggering 41% feel their wage is below fair.
- In general, men are slightly more likely than women to be satisfied with their pay (39% vs 37%).
Salary satisfaction by age
In the world of work, more experience often equals higher pay. But is this always the case?
With factors such as the rising cost of living, inflation and changes in role requirements constantly impacting how we feel about the amount we’re paid, is there any correlation between our perception of salaries and our age?
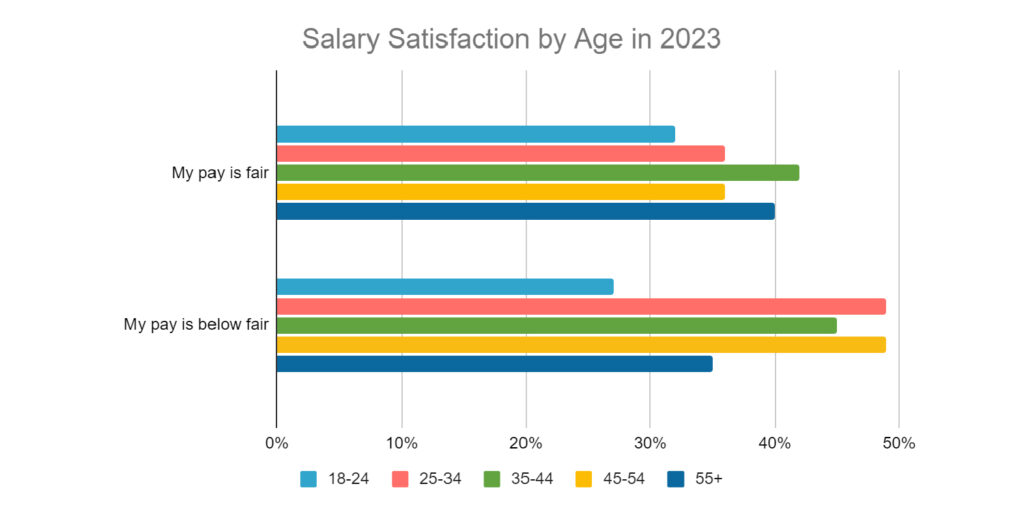
To find out, we asked which age group each of our survey respondents belongs to. In doing so, we discovered that:
- 35-44 year-olds are the most likely to feel fairly compensated for their work (42%) followed by those aged 55 and over (40%).
- Whilst those aged 25-34 and 45-54 are the least likely to feel they’re being paid fairly, almost half (49%) of respondents belonging to these age categories say that their pay is below fair.
Salary satisfaction by UK region
Salaries for the same role can differ vastly from one city or region to another, depending on a wide range of factors. One of which is the cost of living in the area. For instance, jobs in London tend to pay more than the same roles elsewhere, but the prices of houses and rent are also higher in the city. But how about attitudes towards these salaries?
We asked each of our survey respondents which region they lived in, to ascertain any correlations between salary satisfaction and location, and found that:
- People living in the East Midlands are the least satisfied with their pay, with nearly half (46%) stating that they feel their compensation is below fair. That’s more than any other UK region.
- This is followed by those in the North West, 44% of whom feel their salary does not fairly compensate them for the work they do.
- Wales, London and the North East follow in 3rd, 4th and 5th positions when it comes to dissatisfaction with pay.
The table below shows each UK region ranked highest to lowest in terms of what percentage of the population feel their pay is below fair.
| Rank | Region | Percentage who feel their pay is below fair |
| 1. | East Midlands | 46% |
| 2. | North West | 44% |
| 3. | Wales | 44% |
| 4. | London | 42% |
| 5. | North East | 41% |
| 6. | Yorkshire and the Humber | 41% |
| 7. | Scotland | 41% |
| 8. | South West | 38% |
| 9. | East of England | 37% |
| 10. | South East | 37% |
| 11. | West Midlands | 35% |
How comfortable are UK workers with asking for pay rises?
Asking for a pay rise is a daunting prospect for many, even those at the height of their careers who’ve negotiated salaries many times in the past. But with the rising cost of living and hefty increases in inflation, many Brits are finding themselves in difficult situations, leaving them no choice but to request a pay rise or even look elsewhere.
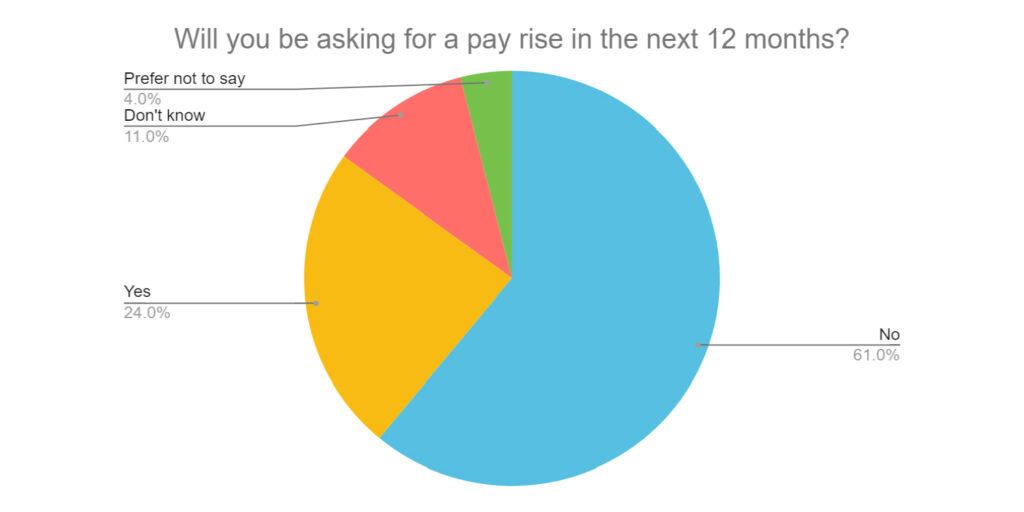
So, how many of us plan to ask for a pay increase in the next 12 months? We asked the participants of our survey, which revealed:
- Less than a quarter (24%) of people in the UK plan on asking for a pay increase at some point in the next year.
- Whilst 61% are not going to ask for a pay rise, even though only 39% feel they’re currently paid fairly.
- Men are far more likely to ask for a pay rise than women, with almost twice as many men than women saying they plan to in the next 12 months (32% vs 18%).
- As you can see from the table below, men also tend to ask for larger pay increases than women.
- In fact, twice as many men than women are planning to ask for a pay rise above the rate of inflation (10% vs 4%).
| Pay increase requested | Men | Women |
| Asking for a raise above the rate of inflation (>11% of current salary) | 10% | 4% |
| Asking for a raise in line with the rate of inflation (11% of current salary) | 14% | 9% |
| Asking for a raise below the rate of inflation (less than 11% of current salary) | 8% | 5% |
How much confidence do British workers have in their companies’ leaders?
Alongside pay, one key factor that influences employee satisfaction rates is confidence in their leaders. Working for a company where your views and values don’t align with those of the people managing the business can be extremely difficult. Whereas working for a company whose vision aligns with your own can often help you to feel more motivated and determined.
So how many people in the UK have confidence in their leaders?
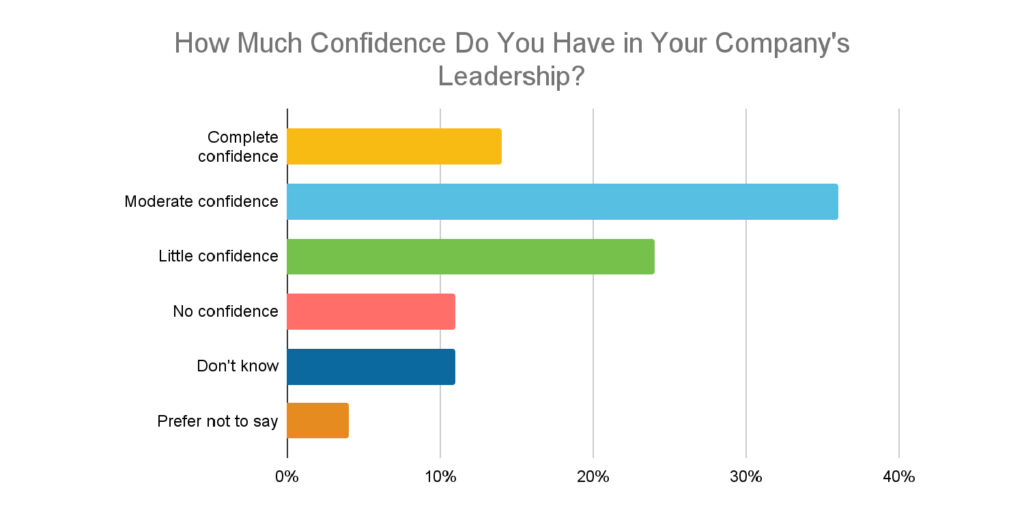
Our survey found:
- Only 14% of UK adults have complete confidence in their leaders at work.
- Just over a third (36%) say they have moderate confidence in their leaders, and feel they are mostly doing a good job.
- Whilst almost a quarter (24%) say they have little confidence in the leadership of their company, and feel there is room for a lot of improvement.
- And more than 1 in 10 (11%) say they have no confidence in the leadership of their company, feeling that they cause more harm than good.
How good do we feel we are at our jobs?
It can be really difficult to put hard work into a job you feel you’re not right for, or that doesn’t play to your strengths. That’s why we asked respondents how self-confident they feel in their ability to do their job.
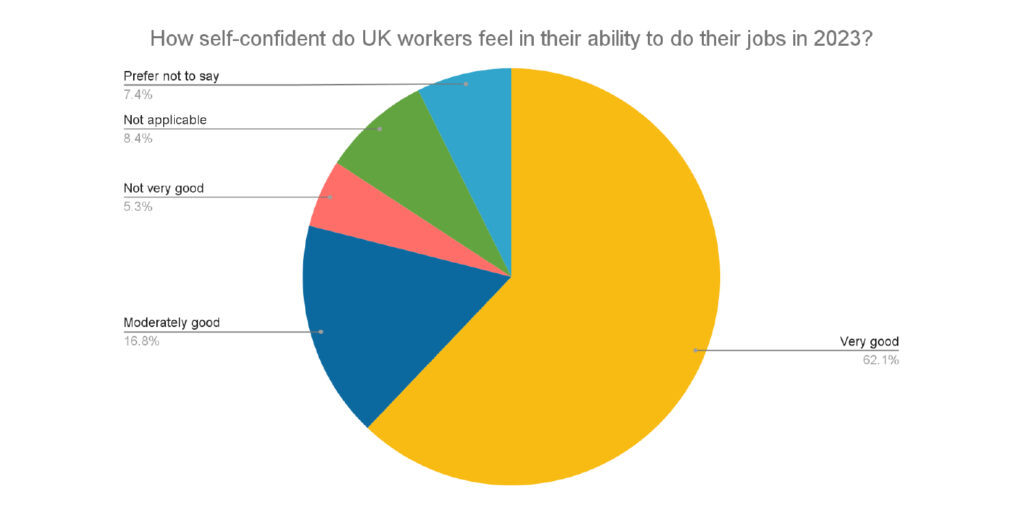
The results revealed:
- 62% of UK adults feel that they’re very good at their jobs
- 17% say they’re moderately good at what they do.
- However, 1 in 20 say that they feel they’re not very good at their jobs (5.3%)
- And 7% said they’d prefer not to answer the question.
Which age groups feel most confident in their abilities in the workplace?
Does workplace confidence increase with age? After having more years of experience behind you and more time to learn and improve? Or are we in fact more confident when we’re younger and perhaps haven’t faced as many challenges or obstacles in our careers yet?
To find out, we asked our participants which age group they were part of, and took a closer look at their responses.

As you can see from the graph:
- The age group that feels the best about their self-confidence in the workplace is those aged 35-44, closely followed by 45-54 year-olds, as 66% and 65% of these age groups say they feel very good about their performance at work.
- This is then followed by those aged 55+ (62%) and those aged between 25 and 34 (55%).
- In contrast, less than a third (30%) of 18-24 year olds say they’re very confident in their abilities to do their jobs.
Does having children impact our confidence in the workplace?
Bringing a child into the world can fill you with a sense of purpose and new-found confidence in yourself. But it can also be exhausting, leading us to feel less able to do things we once had no trouble with. That’s why we asked all of our survey respondents to disclose the number of children they have at home, as well as tell us about how confident they feel in their ability to do their jobs.
The results found:
- 4% of UK adults who don’t have children lack confidence when it comes to their ability to do their job.
- This is doubled in those who have 1 child, as 8% of these parents say they feel unconfident in their performance at work.
- People who have 3 or more children are three times more likely to feel unconfident in their ability to do their job compared with those who have no children.
| Number of children (living at home) | 0 | 1 | 2 | 3+ |
| Percentage who feel ‘not very confident’ in ability to do their job | 4% | 8% | 5% | 12% |
How many UK adults are looking for a new job?
Given that so many UK adults feel dissatisfied with their salaries, leadership, and even their abilities to do their current jobs, it’s unsurprising that every day, tens of thousands of Brits search online for new job opportunities.
But how has the demand for new jobs changed over time?
To find out, we conducted an analysis of Google Trends data between 2018 and 2023 relating to the term ‘jobs near me’:
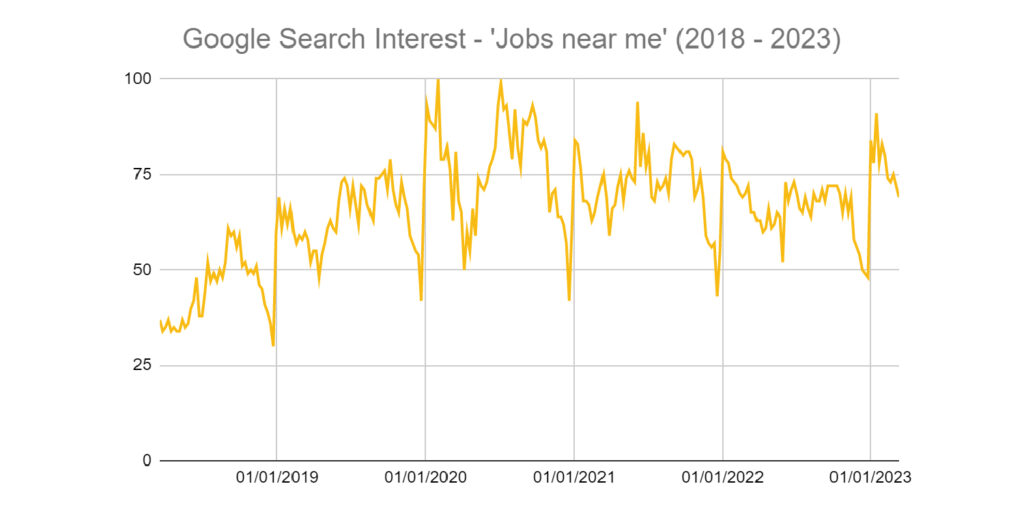
- Each month in the UK, an average of 418,000 searches are conducted for ‘jobs near me’. That’s the equivalent of 13,483 searches every single day!
- Search rates for this term have doubled over the last 6 years, with searches peaking at the start of February 2020, again in July 2020, and in mid-January 2023.
- Searches for ‘jobs near me’ peak in January every year.
The most in-demand jobs in 2023
Whether we’re looking for a new job as a new year’s resolution, switching career paths, or looking to progress into a more advanced role, we Brits carry out a vast array of online searches relating to new jobs every single day.
But which jobs are most in-demand in 2023?
To find out, we used the Keyword Explorer option on the SEO tool, Ahrefs, to analyse the number of average monthly searches in the UK for each of the 100 most popular job roles, followed by the word ‘jobs’.
Our analysis found:
- The most in-demand job role in the UK in 2023 is officially project management, with an average of 5,000 searches being conducted for the term ‘project manager jobs’ each month. That’s 161 searches per day!
- Personal assistant is also amongst the most sought-after job roles, being searched online an average of 4,300 times a month.
- Careers such as electrician, business analyst, sales executive, and receptionist are also amongst the most-searched roles. Alongside accounts assistant, pilot, operations manager and nurse.
The table below shows the top 50 most popular jobs in the UK in 2023.
| Rank | Job role | Average monthly search volume in the UK (2023) |
| 1 | project manager | 5,000 |
| 2 | personal assistant | 4,300 |
| 3 | electrician | 4,200 |
| 4 | business analyst | 4,000 |
| 5 | sales | 3,900 |
| 6 | receptionist | 3,800 |
| 7 | accounts assistant | 2,700 |
| 8 | pilot | 2,700 |
| 9 | operations manager | 2,600 |
| 10 | nurse | 2,300 |
| 11 | recruitment consultant | 2,200 |
| 12 | engineer | 2,200 |
| 13 | software engineer | 2,200 |
| 14 | pa | 2,100 |
| 15 | teacher | 2,100 |
| 16 | account manager | 2,000 |
| 17 | sales assistant | 2,000 |
| 18 | quantity surveyor | 1,900 |
| 19 | CEO | 1,900 |
| 20 | social worker | 1,800 |
| 21 | pharmacist | 1,600 |
| 22 | analyst | 1,600 |
| 23 | product manager | 1,600 |
| 24 | area manager | 1,600 |
| 25 | administrator | 1,600 |
| 26 | GP | 1,600 |
| 27 | web developer | 1,500 |
| 28 | executive assistant | 1,500 |
| 29 | office manager | 1,400 |
| 30 | software developer | 1,400 |
| 31 | driver | 1,400 |
| 32 | management accountant | 1,400 |
| 33 | team leader | 1,300 |
| 34 | marketing manager | 1,300 |
| 35 | assistant manager | 1,300 |
| 36 | store manager | 1,300 |
| 37 | hr administrator | 1,200 |
| 38 | marketing assistant | 1,200 |
| 39 | assistant accountant | 1,200 |
| 40 | finance manager | 1,100 |
| 41 | accountant | 1,100 |
| 42 | buyer | 1,100 |
| 43 | hr advisor | 1,000 |
| 44 | graphic designer | 1,000 |
| 45 | manager | 1,000 |
| 46 | programme manager | 900 |
| 47 | production manager | 900 |
| 48 | plumber | 900 |
| 49 | researcher | 900 |
| 50 | sales manager | 900 |
Thanks for reading
We hope these findings have been useful in providing a good overview of the most up-to-date facts, figures and statistics surrounding employee satisfaction in 2023! If you’re unhappy with your current job and are thinking about starting your own business, we can help. Head over to our company formation packages page or have a chat with a member of our friendly team on 020 3897 2233.
Please note that the information provided in this article is for general informational purposes only and does not constitute legal, tax, or professional advice. While our aim is that the content is accurate and up to date, it should not be relied upon as a substitute for tailored advice from qualified professionals. We strongly recommend that you seek independent legal and tax advice specific to your circumstances before acting on any information contained in this article. We accept no responsibility or liability for any loss or damage that may result from your reliance on the information provided in this article. Use of the information contained in this article is entirely at your own risk.


Join The Discussion
Comments (4)
What an informative blog post and very eye opening
We’re glad you found this post useful, James.
Kind regards,
The 1st Formations Team
This was really fun to read!
We’re glad you found this article fun to read, Scarlett.
Kind regards,
The 1st Formations Team